Peek-a-Boo: I see your smart home activities, even encrypted!
Authors: Abbas Acar, Hossein Fereidooni, Tigist Abera, Amit Kumar Sikder, Markus Miettinen, Hidayet Aksu, Mauro Conti, Ahmad-Reza Sadeghi, A. Selcuk Uluagac
Link: https://arxiv.org/pdf/1808.02741.pdf
Corresponding Author: Abbas Acar
Abstract: A myriad of IoT devices such as bulbs, switches, speakers in a smart home environment allow users to easily control the physical world around them and facilitate their living styles through the sensors already embedded in these devices. Sensor data contains a lot of sensitive information about the user and devices. However, an attacker inside or near a smart home environment can potentially exploit the innate wireless medium used by these devices to exfiltrate sensitive information from the encrypted payload (i.e., sensor data) about the users and their activities, invading user privacy. With this in mind, in this work, we introduce a novel multi-stage privacy attack against user privacy in a smart environment. It is realized utilizing state-of-the-art machine-learning approaches for detecting and identifying particular types of IoT devices, their actions, states, and ongoing user activities in a cascading style by only observing passively the traffic from smart home devices and sensors. The attack effectively works on both encrypted and unencrypted communications. We evaluate the efficiency of the attack with real measurements from an extensive set of popular off-the-shelf smart home IoT devices and sensors utilizing a set of diverse network protocols like WiFi, ZigBee, and BLE. Our results show that an adversary passively sniffing the traffic can achieve very high accuracy (above 90%) in identifying the state and actions of targeted smart home devices and their users. To protect against this privacy leakage, we also propose a countermeasure based on generating spoofed traffic to hide the real activities of the devices. We also demonstrate that the provided solution provides better protection than existing solutions.
1 Introduction
Previously, the Internet was mainly used for accessing and displaying content of web pages (i.e., web browsing). However, with the emergence of IoT devices in smart homes, users have now the ability to control
their home’s electronic systems (e.g., smart bulbs, smart locks, sensors, etc.) using appropriate smartphone apps and also from remote locations [27]. To realize smart home automation, the devices are mostly equipped with embedded sensors. These sensors collect data from the environment and help user to control them. Moreover, smart home devices are also continuously communicating with associated back-end system servers or other devices (e.g., smart hubs) to transmit the sensor data in a real-time manner. On the other hand, as IoT devices usually are single-purpose devices, the capabilities of individual smart home devices are relatively limited, comprising only a few states or actions. For example, a motion sensor allows a user to detect any movement in a physical space, but the sensor has only two states: motion and no-motion. If an attacker can reveal the current state of the sensor, the attacker will also reveal the presence of the user at home.
Given that the communications among the server, sensors, smart-hub, and the smart home devices are
usually encrypted using standard protocols like WPA2, in the case of WiFi, the contents of the exchanged
messages or commands are hidden. However, the encryption only hides the payload, related meta-data
(e.g., packet lengths, traffic rate) of the network traffic still leaks some information about the messages exchanged [10, 11, 21, 31, 32, 35].
Identification of the encrypted traffic is a wellstudied problem. However, applying traditional identification methods such as statistical techniques [32] in the domain of smart home is not straightforward due to challenges arising from the inherent properties of IoT devices. First, unlike targets using a widely-deployed protocol to perform a well-known specific activity like web browsing, in the smart home context, the targeted device population is much more heterogeneous and uses various network protocols such as WiFi, ZigBee, BLE, etc. for supporting an even wider variety of device-type-specific, potentially proprietary application protocols. This naturally extends the potential attack surface, but also makes it even harder to devise generic attacks or countermeasures.
Some earlier works [4, 5, 30] have shown that it is relatively easy to make some simple inferences such as device type inference [24], identifying the user occupancy via detecting the mode transition between the device
activities [12], or simple device mode inference [5]. However, combining such partial information from different
smart home devices to get a more meaningful picture about a user’s actions or his/her activity profile is challenging. This is because a successful attacker must aggregate information about actions over a longer period of time from a multitude of smart home devices, which is only feasible if activity detection and identification can be automated to a large degree to keep the required effort manageable.
In this paper, we demonstrate how machine learning methods based on traffic profiling of smart home IoT device communications can be used by an adversary to automatically identify actions and activities of the IoT devices and its users in a victim’s smart home with very high accuracy, even if only encrypted data are available. Indeed, device types, daily mundane activities of the users (e.g., left home, walking from kitchen to bedroom), or states of the devices (e.g., door locked, unlocked) can all be easily identified even if the traffic is encrypted, thus posing a threat to user privacy. We refer to this novel attack to user privacy as multistage privacy attack, which is achieved in a cascading style by only observing passively the wireless traffic from smart home devices. In this, a passive attacker can easily realize the multi-stage privacy attack to extract meaningful data from any smart environment equipped with smart devices including personal homes, residences, hotel rooms, offices of corporations or government agencies. Here, unlike earlier approaches, the presented attack is
device-type and protocol-agnostic, making it easily applicable to a wide variety of different IoT device types
without the need for tedious harvesting of device-type or protocol-specific knowledge about specifications for
supporting the activity identification task.
We evaluate the effectiveness of the novel multistage privacy attack with 22 different off-the-shelf IoT devices utilizing the most popular wireless protocols for IoT. Our experimental results show that an attacker can achieve very high accuracy (above 90 %) in identification of the types, actions, states, activities of the devices and sensors. Moreover, to counter the identified privacy threats posed by the multi-stage privacy attack, we also propose a new effective countermeasure solution based on generating spoofed traffic to hide the real states of targeted IoT devices and thereby the real activities of the users. Our solution does not require modifications in targeted IoT devices and is, therefore, easier to deploy than previously proposed solutions for IoT devices, for which it is very difficult to implement client-based countermeasures due to the vast heterogeneity of smart devices and limited resources available on the IoT devices. Also, even if the user is not at home, a fake traffic-based solution for the user’s presence will mask the user’s absence, further improving privacy.
Contributions: The contributions of this work are as follows:
- We propose a novel multi-stage privacy attack on smart home users and devices which can leak sensitive information including types of devices, states of the devices, sensor data, and on-going user activities. To the best of our knowledge, this is the first work showing all the stages of an attack that can reveal the user activities from the raw traffic of smart home devices, even encrypted.
- The attack includes several novel techniques for effectively reducing the effort needed for the user activity inference on the timing-based heterogeneous network traffic to Machine Learning (ML) problem. We further extend the attack using the Hidden Markov Model (HMM) to infer user activities.
- We evaluate our proposed novel attack with a dataset of popular commercial smart home devices
(n=22). We show that an attacker can automatically detect and identify device actions with high accuracy (> 90%), allowing an adversary to infer potentially sensitive information about the smart home users. - Finally, although the focus of this paper is on the novel attack, we also propose a new solution based
on traffic spoofing to address this new privacy threat while demonstrating its efficacy over existing solutions (Sec. 5).
Organization: The rest of this paper is organized as follows: In Section 2, we present the adversary model considered in this paper. Then, a background about the capabilities and the communication features of the smart
home devices are presented in Section 3. Section 4 details the stages of our main proposed multi-stage attacks,
where the results are presented in every sub-section. In addition, we present a solution to mitigate this privacy
leaks in Section 5. Finally, the related works are given in Section 7 and the paper is concluded in Section 8.
2 Adversary Model
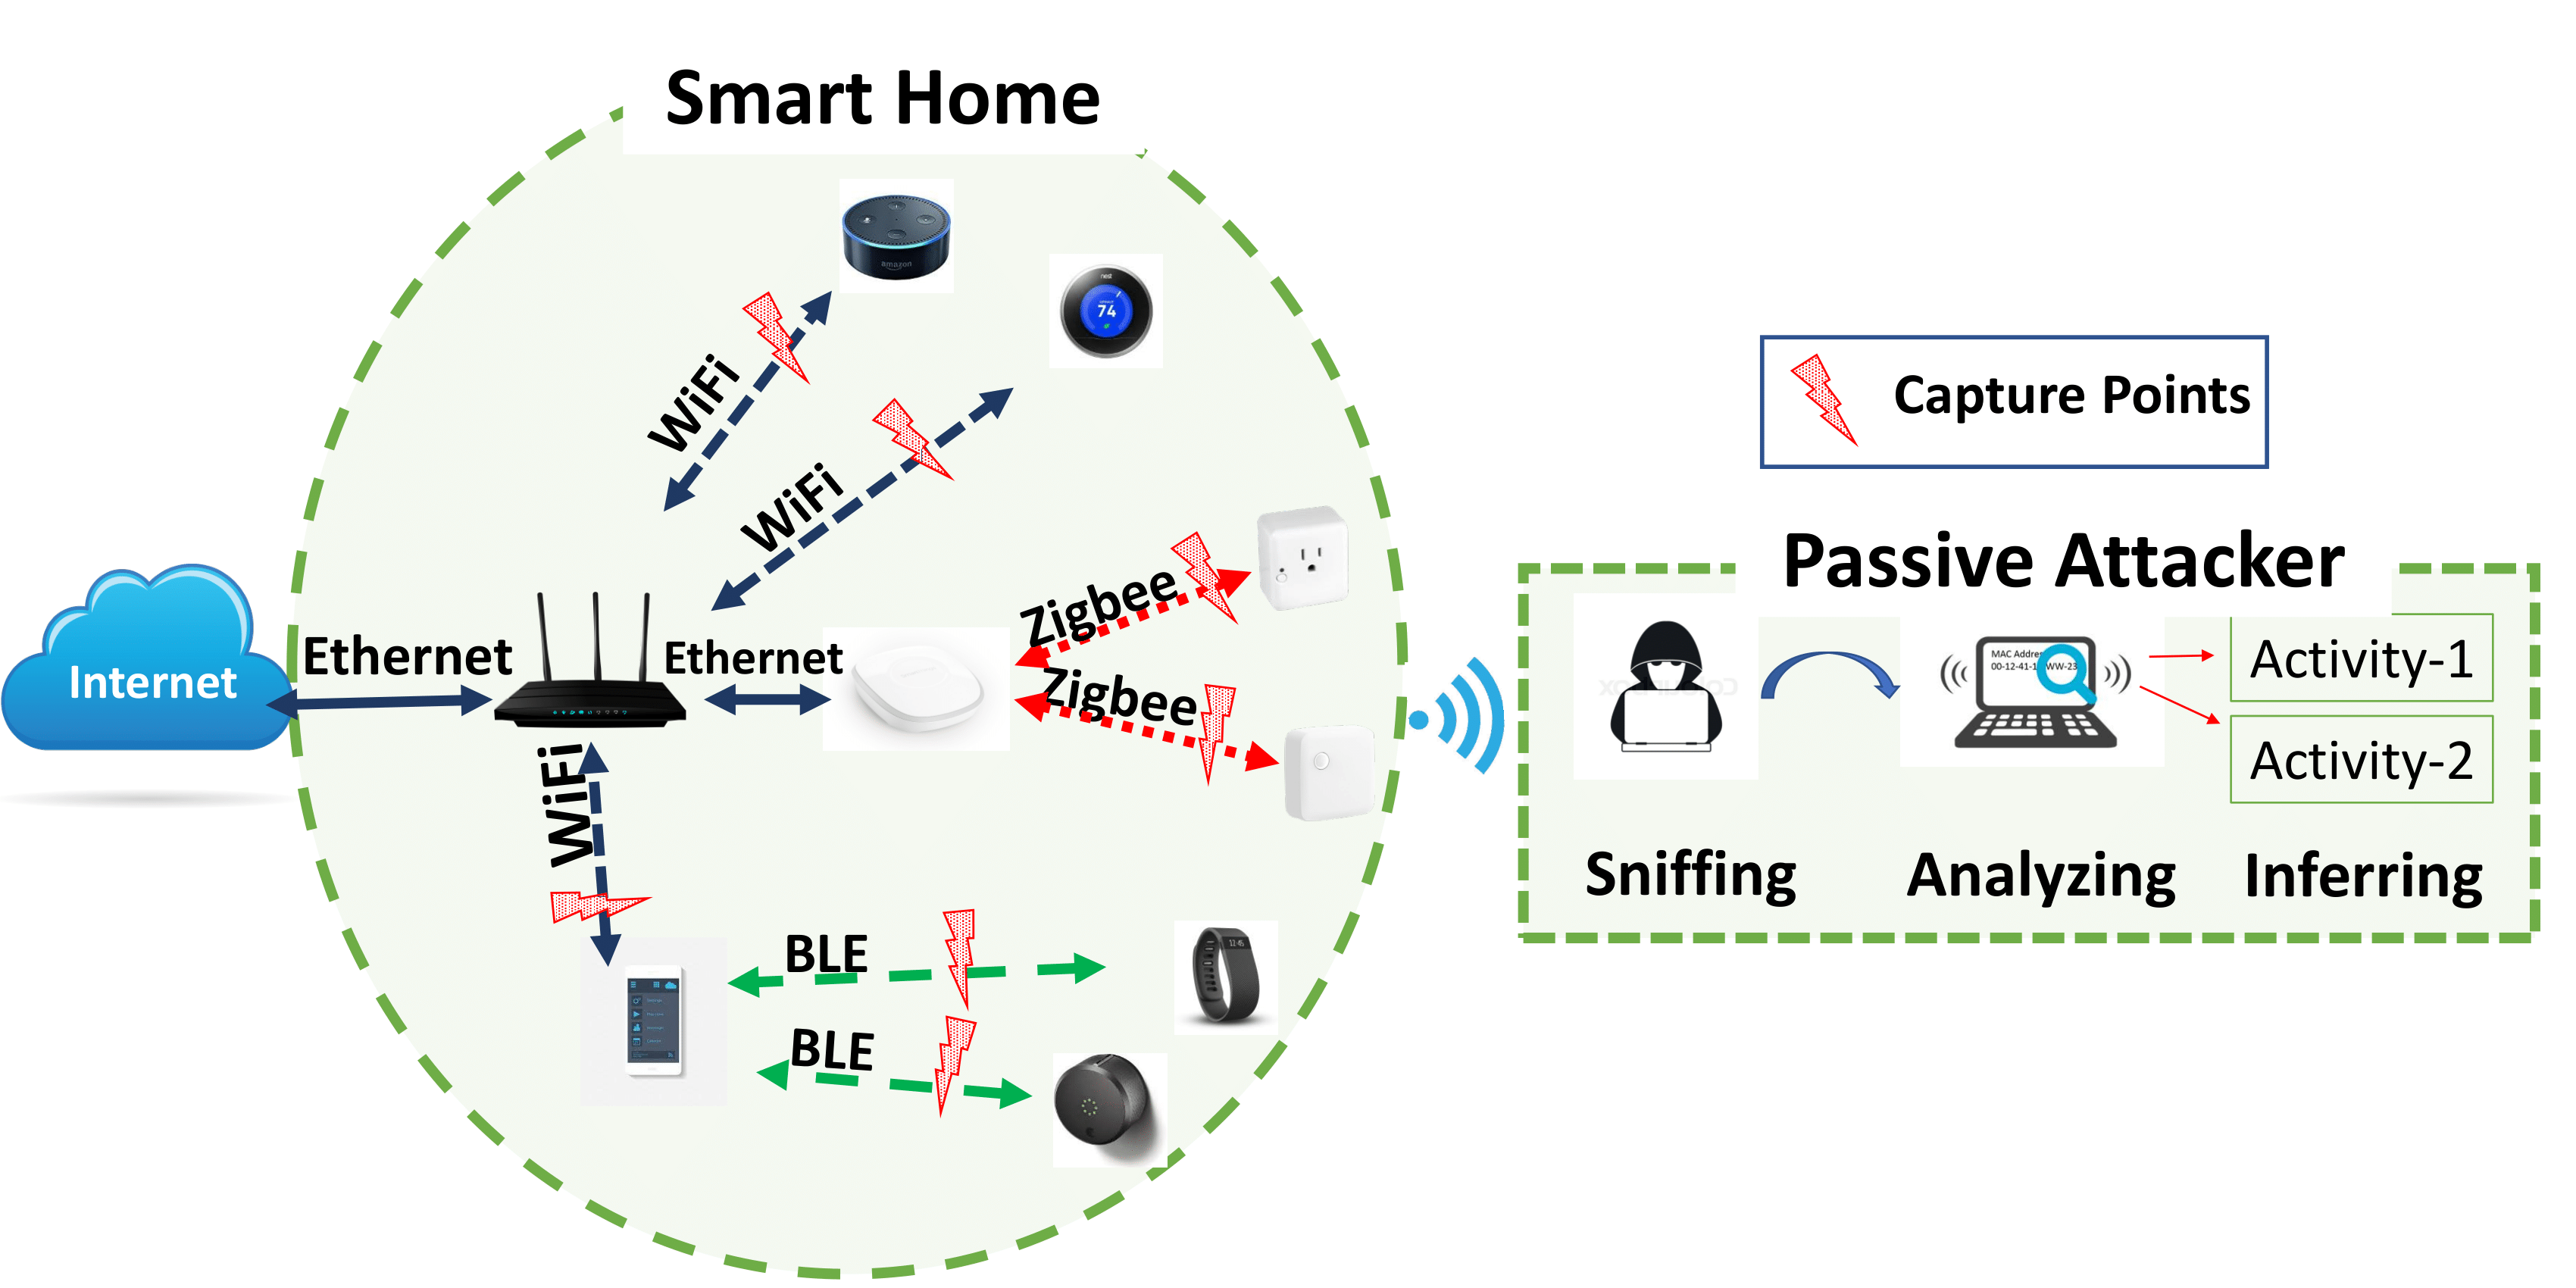
Figure. 1. Local adversary model considered in this paper.
One of the unique challenges in the domain of IoT, and particularly smart home, is that the attack surface is naturally extended and comprises a diverse set of devices and sensors deployed at the user’s home. Figure 1 shows some of the data capturing points that an attacker can take advantage of when inferring user activities. In
this work, we consider a local adversary located physically within the wireless range of the targeted user’s smart home devices similar to [17–19]. For this, the attacker can install the sniffers only once and even manage them remotely. Or, it could compromise a device inside the smart home, remotely, and turn it into a sniffer. In
this way, the attacker may never need to be present. In all these cases, the adversary can eavesdrop on various wireless IoT network communications transmitted by the user’s smart home devices. For example, as presented in Figure 1, the attacker can sniff all the network traffic transmitted over WiFi, BLE, and ZigBee protocols. The attacker only needs to passively sniff the network traffic and does not need to interrupt. Therefore, the attacker may stay active long enough without being detected by the victim. A stronger adversary would be an adversary who can launch the attack remotely, i.e., intercepting the network traffic over the Internet such as a malicious ISP.
Assumptions. We further make the following assumptions:
- The attacker has access to the same kind of smart home devices and sensors as the targeted user, s/he
can analyze the devices by collecting the traffic of these devices, and use the collected data to train its
algorithms. - The attacker has access to protocol headers data on all layers that are not protected by encryption.
- The attacker does not need to know the specifications of analyzed protocols, instead, it only needs
to know how to run the already publicly available
scripts, which does not require extensive knowledge about the specifications of the protocol itself.
Moreover, it can also use Layer 2 information like MAC addresses, or BLE advertisement packets, to
automatically identify additional information, the brand of individual devices, thereby reducing the
search space of devices to guess the set of smart home devices that the targeted user is using. Moreover, it is also worth noting that the attacker does not need exactly the same devices to train its algorithm,
but it needs the exact brand and device type to get the results presented in this paper as we use the
< brand, device − type > pair to uniquely identify devices.
Attacker’s goals. We model the attacker’s goals under four different categories:
- Goal-1: The attacker aims to infer the devices used in a smart home. (Section 4.4)
- Goal-2: The attacker aims to infer the daily routine of the user. (Section 4.5)
- Goal-3: The attacker aims to infer the state of a specific smart home device. (Section 4.6)
- Goal-4: The attacker aims to infer specific user activities from the states of multiple devices. (Section 4.7)
3 Smart Home Devices
In this section, we describe the typical characteristics of smart home devices relevant to this paper. First, we
classify the smart devices according to their capabilities. This capability-based classification can also be used to
classify the device actions. Second, we present required background information about the communication protocols used by these devices.

Table 1. The communication protocols and capabilities of the smart home devices used.
3.1 Capabilities of Smart Devices
We categorize smart devices in our study into three categories in terms of their capabilities. The first category
is the Hub-like devices. They are central communication hubs that connect other devices to both each other and
to the Internet. They mostly do not provide a functionality of their own to users as their main purpose is to act as gateways connecting devices using other protocols than WiFi to the smart home network. In some cases, like the Samsung ST Hub, they serve as a centralized platform to install and run smart home apps for different smart devices. The second category of devices is User-controlled devices. These devices can be controlled by their users either manually or via a controller device like a smartphone or tablet. Examples of such devices include Smart Lights, Smart Switches or Smart Locks. These devices can be controlled both remotely and locally by the user. The third category is Sensor-like devices. These devices are the most primitive ones and have only the capability of sensing the environment via their built-in sensors. An example of this type of device is the Samsung ST Motion Sensor, which can detect persons moving in its proximity. These devices send notification messages to their associated services either when an event takes place, or periodically. All the devices studied in this paper are shown in Table 1.
Apart from these devices, a typical smart home environment uses a smartphone or tablet as a controller device to control smart home devices. The smartphone or tablet can also be used as an interface to connect smart devices and smart home hubs and install different apps on the devices. We consider the smartphone or tablet as the controller device in the user activity inference.
3.2 Communication Features
Both the smart home vendors and users mostly prefer wireless communication over wired communication as it
is more convenient. However, compared to wired communication, the wireless network traffic from smart home
devices is open to the eavesdropping attacks.
In this work, we target three wireless protocols: WiFi, ZigBee, and Bluetooth Low Energy (BLE). Among these, WiFi is used in the wired or plugged-in devices, while other protocols, ZigBee and BLE, are implemented for short-range communication tasks of battery-powered devices as they consume less power than WiFi.
3.2.1 WiFi-enabled devices
WiFi-enabled devices are connected to the Internet either through a Hub-like device or directly connected
to an access point. In both cases, the adversary can track and capture the traffic through a specific device
via MAC address. Even though MAC addresses may help the attacker to narrow down the device type, it can
not precisely decide the device type from MAC address. It may want to use IP addresses of servers. However,
the adversary can only see the traffic that is encrypted by both the network protocols (SSL/TLS) and WiFi
encryption (WPA). Therefore, it cannot see the IP or transport layer headers encrypted by the WPA protocol. This prevents the attacker from using header-based features for the device identification. However, the traffic rates of the devices still cannot be hidden from the attacker.
3.2.2 ZigBee-enabled devices
ZigBee devices have two addresses: MAC address and Network Address (NwkAddr). The MAC address is exactly the same as the MAC used in WiFi-enabled devices, which is unique for every device in the world
and never changes. On the other hand, NwkAddr is created and assigned when the device joins a network and
changes when it leaves and re-joins another network. It is similar to IP, however, it is not encrypted and source
and destination NwkAddr of the packets can be seen by the attacker. In addition, the network coordinator
(i.e., hub) has the 0x0000 address and each network has a unique identifier, called the Personal Area Network
Identifier (PAN ID). This information may additionally help the attacker.
3.2.3 BLE-enabled devices
In a BLE network, a device can be either a master or a slave. A slave can connect to only one master node
while a master can connect to multiple slave nodes. In all the smart home devices that we used, while the smartphone acts as a master, targeted smart device acted as a slave. Before establishing the connection, a slave device broadcasts advertising packets (ADV_IND) randomly on channel 37, 38, and 39. Once a connection starts, they agree on a channel map, where they follow in the rest of the communication. If an attacker wants to follow the BLE traffic through a smart device, it needs to capture the first packet so that it can learn the channel
mapping. Once the attacker captures the access address, it can follow the rest of the communication.
4 Multi-stage Privacy Attack
Our novel multi-stage privacy attack consists of four stages connected in a cascaded manner. While the goal of the attack is to infer user activities at the final stage, every stage also leaks partial information about devices and their actions and can be independently used by the attacker for various purposes. In the following, we first outline the high-level overview of the attack and then present details of individual stages and related results.
4.1 Attack Stages
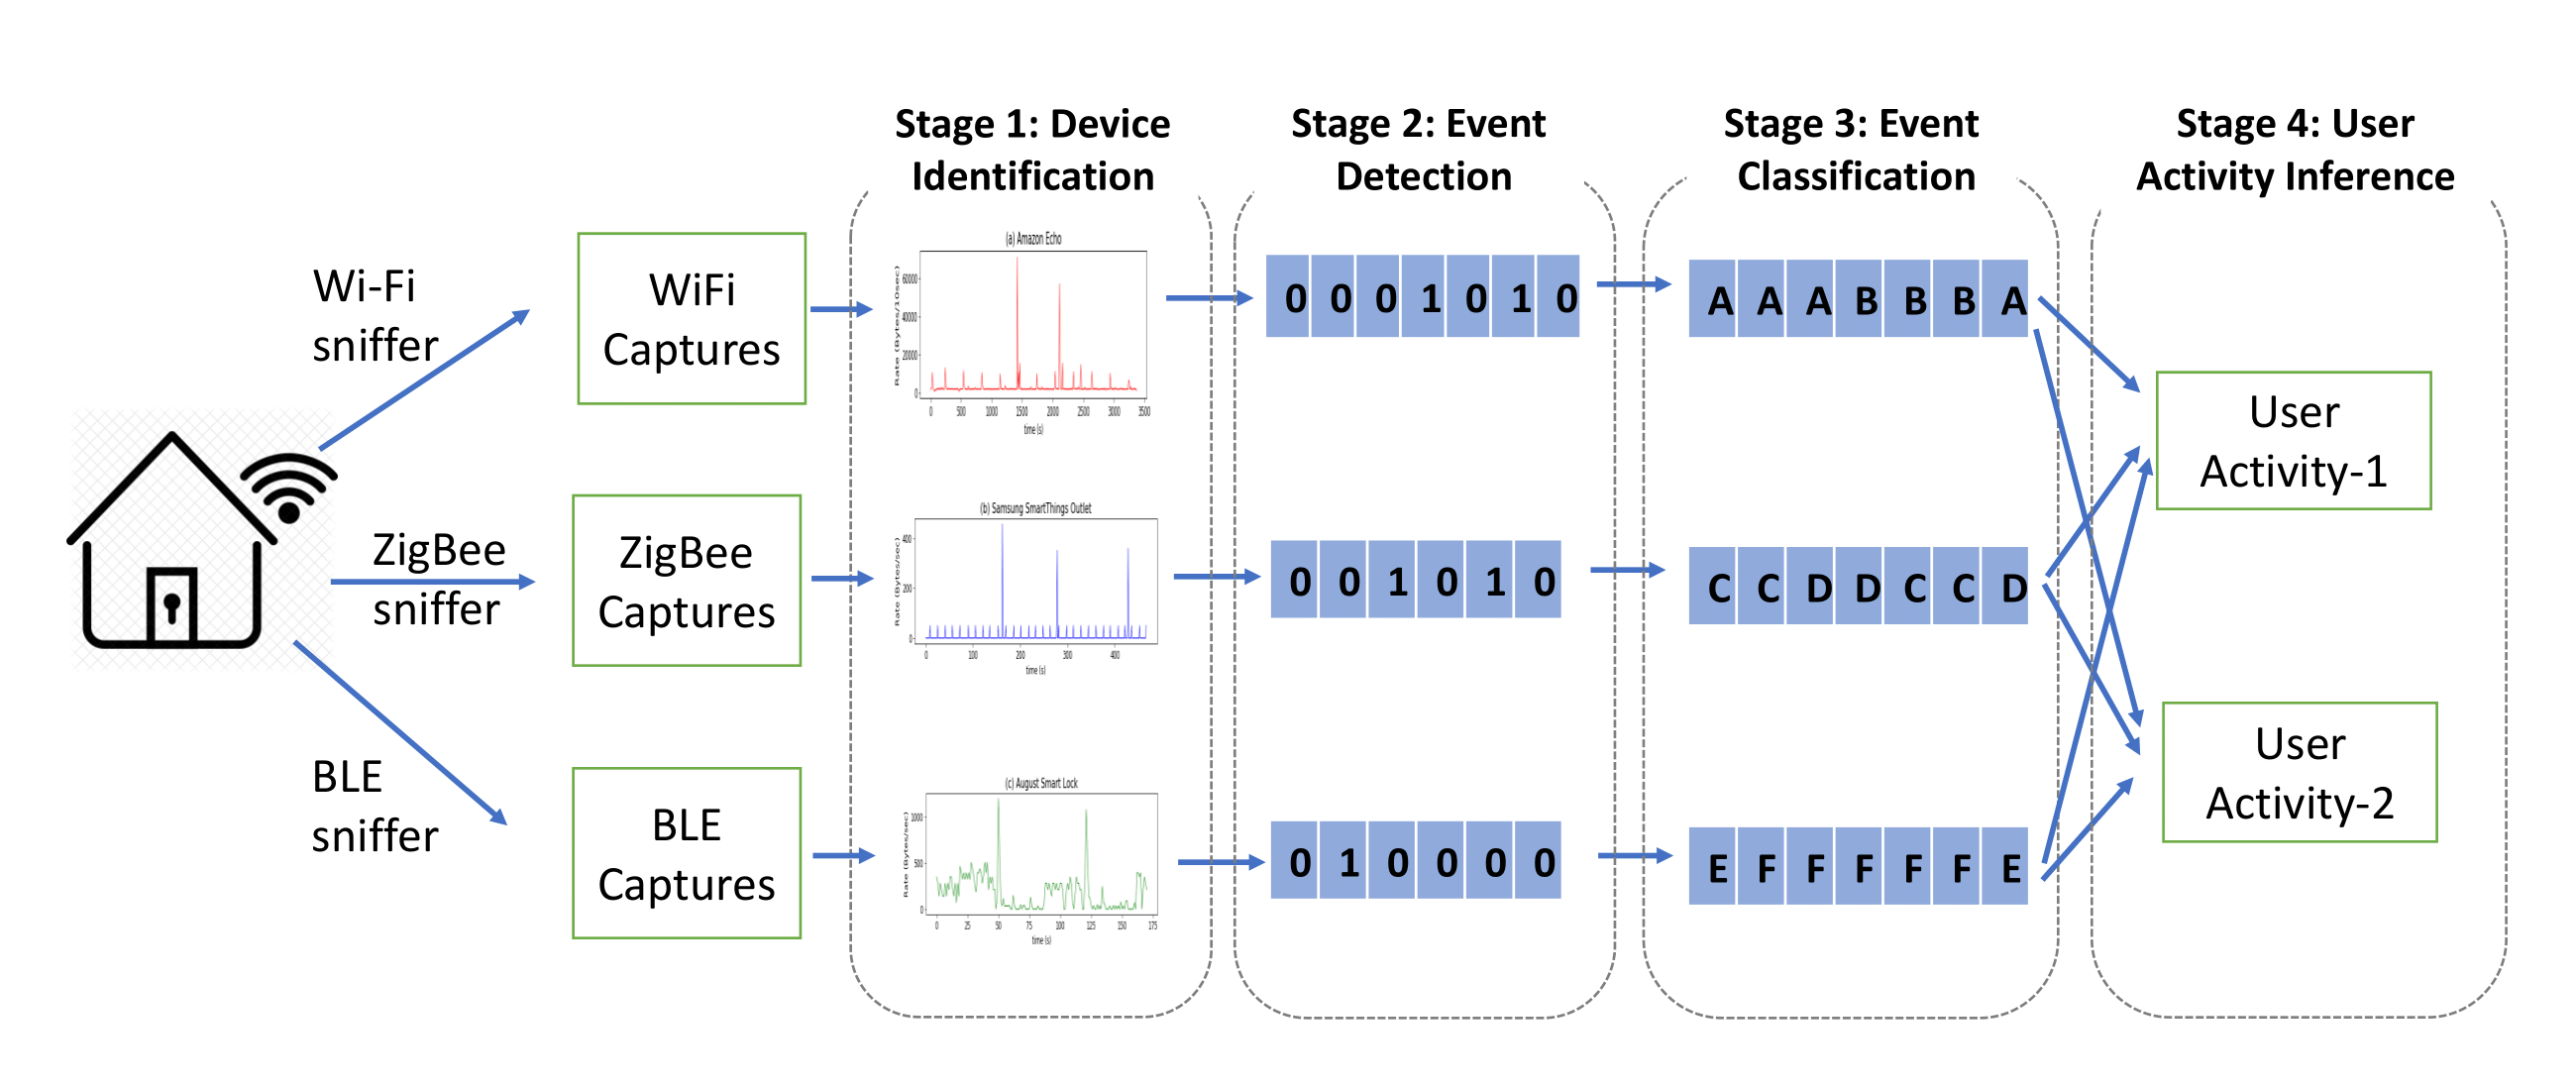
Figure 2. Overview of the multi-stage privacy attack.
Stage-1: In the first stage, the attacker’s goal is to identify the type of each smart home device. Even though used protocols use unique identifiers for each device (e.g., MAC address, NwkAddr), the attacker does not
know the device type a specific address corresponds to. By sniffing packets of individual protocols, the attacker will obtain network traffic profiles of all devices using that protocol. Identifying individual devices’ device types becomes then a multi-class classification task based on the traffic profiles of individual devices.
Stage-2: After discovering the types of individual devices, the attacker’s goal is to infer the state of individual devices. As shown in Figure 6, a state change typically results in a significant increase in network traffic related to the device, causing an increase in the data rate and a decrease in the inter-arrival time of the packets. Therefore, the attacker can in most cases detect state changes of devices by observing changes in these metrics. The attacker converts the network packets into 1s and 0s, where the 1s show where the transition occurred.
Stage-3: After detecting transitions between the device states, the attacker splits the network trace of a device
into segments corresponding to different device states (e.g., ON, OFF). Identifying these states is then reduced
to a multi-class classification problem, where classes represent possible device states.
Stage-4: In this stage, by using the results of the state classification in Stage-3, the attacker knows the inferred
states of all devices. For example, at a particular moment, the attacker may know the smart lock is in the
LOCKED state, no motion is detected in the motion sensor placed in the kitchen and so on. Using the state
information of the devices, the attacker can guess that the user is sleeping. Any user activity in a smart home
can be inferred by observing the inferred states of devices and sensors and using a Hidden Markov Model to
infer the corresponding user activity. In the next sections, we evaluate the efficiency of our multi-stage privacy attack on network traffic data collected from 22 different off-the-shelf IoT devices used in smart homes.
4.2 Dataset and Evaluation Metrics
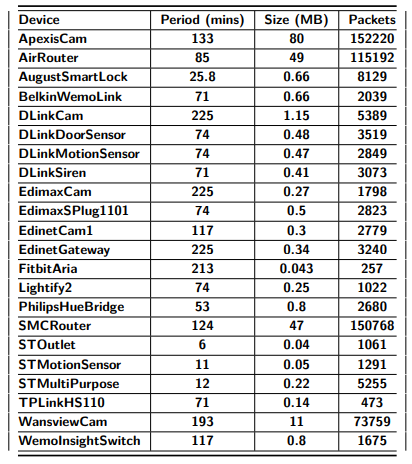
Table 2. Characteristics of network traces used in experiments.
In order to evaluate the attacks in the stages above, we collected the network data from 22 different smart home
devices. Data collection was performed in two stages: In the first stage, controlled experiments were performed
in which detailed instructions were followed to initiate specific actions on the tested device. These instructions
were compiled based on the on-line or hardcopy manual of each tested device (specs and data sheets). The controlled experiments were performed in order to ensure that all relevant actions for each device were represented in the usage dataset sufficiently many times. Each experiment was therefore repeated n = 20 times for each device. In addition to the controlled experiments, also uncontrolled testing was performed in order to capture background traffic of relevant devices. In this set-up, several devices were configured to be used simultaneously and device actions were occasionally triggered during a test period of ca. 1-2 hours.
The duration and the total size of the captures and the number of the packets are given in Table 2. The
devices used include a representative cross-section of IoT device types, typically available in the European
and North American markets during the study. The devices were also selected based on the market share of
different device categories. The most popular device categories are smart security systems such as smart cameras and smart locks (22.2%), lighting (3.03%), outlets and switches (1%), gateways including hubs and routers (24.5%), and smart speakers (22.39%) [3]. In addition to these categories, we also included several smart sensors as these devices hold significant smart home market share (approximately 23.9%) [20]. We installed all the devices in a laboratory network and emulated user inputs triggering device state changes. We captured all the network traffic from a device and performed the analysis offline.
For evaluating the efficiency of our attacks, we use different metrics. First, we use accuracy, which is the ratio of correctly inferred observations to total observations. In some cases, as in real deployments, the collected network data may have imbalanced data, where the duration of the active state is much less than the
inactive one. In those cases, we use additional metrics such as Precision, Recall, F1 score, and Support. In the
cases that the dataset includes a lot more label 0 (no activity) rows than label 1 (activity) rows, we observed
that F1 score is a better performance measurement than accuracy although accuracy is a more intuitive performance measurement, in general. The detailed calculation of these evaluation metrics is given in Appendix B.
4.3 Calculating Features from Network traffic
In this sub-section, we explain how we use the traffic flow for the classification task. Particularly, we take advantage of the fact that while the encryption layer in the protocol protects the payload of a packet, it fails to
hide other information revealed by network traffic patterns, for instance, sequence of packet lengths (SPL) and
direction (incoming/outgoing). We consider each network traffic flow as a time ordered sequence of packets
exchanged between two peers during a session. Before processing the network traffic for classification, we converted packet in traffic flow into a Sequence of Packet Lengths and Times (SPLT) as in following format:
pkt = [timestamp, direction, packet length], (1)
where the direction is 1(0) if it is an incoming (outgoing) packet. This transformation is done for each packet in
the captured trace, where each result is written to a new row. In the end, we obtained a matrix with three
columns. Then, in the feature extraction of each attack, we calculated the features from this matrix.
4.4 Stage-1: Device Identification
Several different identification approaches for IoT devices have been proposed in the literature. Numerous works
have shown that IoT devices can be identified with high accuracy for both WiFi-enabled [7, 13, 23, 24, 26]
and BLE-enabled [14] devices. Therefore, in this section (e.g., Stage-1), we implemented an already existing device identification algorithm for ZigBee-enabled smart home devices using our features to see whether we can identify the ZigBee-enabled smart home devices from their network traffic.
In our dataset, each device can be uniquely identified by the < brand, device−type > pair. We did not consider the different models of devices as different devices. On the other hand, a hub in ZigBee always uses the network address 0x0000, so it can be easily recognized by the attacker. Therefore, we did not include the hub in the identification of ZigBee devices. After collecting ZigBee network traffic, the second step involves extracting the features to identify the devices. In this step, the features we used include mean packet length, mean interarrival time, and standard deviation in packet lengths. We split each individual network traffic trace of a device into equal time intervals (e.g., 5 sec, 10 sec). Then, we calculated these features for each interval.
For the classification, we used the kNN classification algorithm. The classifier could correctly identify devices with an overall accuracy of 93% for ZigBee devices. This shows that as for WiFi and BLE, also devices using ZigBee can be identified with high accuracy.
4.5 Stage-2: Device State Detection
When an interaction between the device and the user occurs, a significant amount of data is transmitted, which
leads to a significant increase in the traffic rate. After this data exchange, the data transmission drops to the
minimum until a new interaction starts. When there is no activity, only the minimum amount of continuation
packets like heartbeat messages are sent to minimize the device’s power and bandwidth consumption. We also observed that almost the same amount of data transfer occurs for the same activities. All this information allows
us to detect transitions between the activities or states of the device. For further validation, we do the following
experiments.
Feature Extraction: Our goal is to transform a sequence of packets into a supervised learning dataset. To achieve this, we divided the sequence of packets into windows of size W. For a given time interval length W, we extracted a feature vector comprised of three variables: mean packet length, mean inter-arrival time and median absolute deviation of packet size. Based on timestamped labels telling whether an activity was ongoing or not, we labeled the given vector with 1 for an ongoing activity or 0 for no activity. We found that the window size has
significant influence on the performance of our model. The window size for the best performance depends on
adjusting the size according to the duration of the activity. In general, selecting a smaller window size improves
the performance until some level, but any further reduction results in decline of the performance. From our
observation, better performance was observed when the window size is about a quarter of the duration of an
activity.
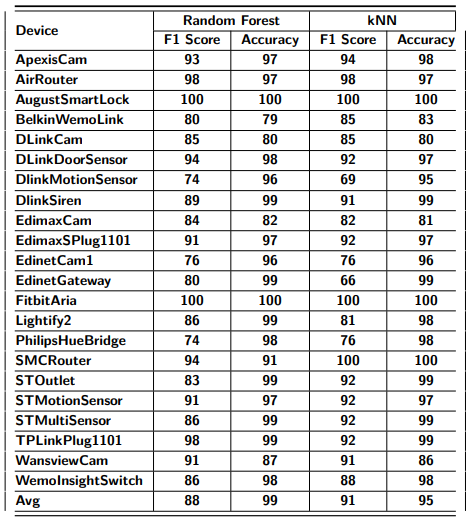
Table 1. Evaluation results of the device state detection stage.
Results: After obtaining feature vectors with labels from the sequence of packets, any supervised learning algorithm can be applied on the dataset. We have evaluated two supervised learning algorithms, namely Random Forest classifier (RF) and k-Nearest Neighbors classifier (kNN). As shown in Table 3 both RF and kNN have similar performance with RF averaging 88% and kNN with 91% average of correctly detecting activities. F1 Score of each device in Table 3 differs slightly. DlinkMotionSensor has the worst F1 score 74% using RF and 69% using kNN and the best F1 score is 100% for the Aria Fitbit and AugustSmartLock.
4.6 Stage-3: Device State Classification
In the device state classification experiments, the attacker’s goal is to decide the state of the device (e.g., deciding if it is ON or OFF). When looking at the device’s exchanged network packets, unlike previous steps, this
is more difficult to determine. However, each state has a unique pattern that helps us to differentiate them
from each other. In order to see if it is possible to differentiate the states, we did the following experiments:
Feature extraction: To conduct device state classification, informative and distinctive features must be extracted from time-series generated in the preprocessing steps. We used the tsfresh [1] tool that automatically calculates a large number of time series characteristics and features and then constructed our feature vector. Examples of the features extracted from time-series are as follows: Absolute Energy of time-series, Length of time-series, Mean of time-series, Median of time-series, Skewness of time-series, Entropy of time-series, Standard deviation of time-series, Variance of time-series, Continuous wavelet transform coefficients, Fast Fourier Transform Coefficients, Coefficients of polynomial fitted to time-series.
Feature selection: The output of the feature extraction phase is a set of feature vectors including 795 binary features. A large number of features, some of which redundant or irrelevant might present several problems such as misleading the learning algorithm, and increasing model complexity. A feature selection technique was therefore used to mitigate these problems and also to reduce over-fitting, training time and improve accuracy. We used a technique leveraging ensembles of randomized decision trees (i.e., Extra Trees-Classifier) for determining the importance of individual features. We exploited Extra-Trees Classifier to compute the relative importance of each attribute to inform feature selection. The features considered unimportant were discarded. The feature selection phase effectively reduced the feature vector size from 795 binary features to 197 features.

Table 2. Cross-validation and hold-out validation results for device state classification.
Results: Our objective was to build a performant model to correctly classify IoT devices’ states even if their traffic is encrypted. To this end, we employed several machine learning algorithms for the classification such as XGBoost, Adaboost, Random Forest, SVM with RBF kernel, kNN, Logistic Regression, Naïve Bayes, and Decision Tree. In order to ensure that our machine learning model got the most of the patterns from the training data correctly, and it was not picking up too much noise, we shuffled and split the data-points to conduct the following experiments: (i) we performed 5-fold Cross-Validation (CV) on a training set of 377 samples (75% of data) for assessing the effectiveness of the machine learning model and (ii) we carried out Hold-out Validation on 126 samples (25% of data) to test the machine learning model performance against unseen data.
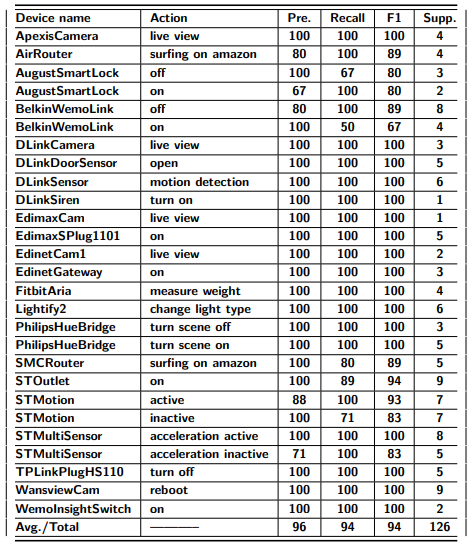
Table 3. Hold-out validation results of RF classifier for all IoT devices.
5-fold Cross-Validation: To avoid the risk of missing important patterns or trends in the dataset, we applied cross-validation, as it provides ample data for training the model and also leaves ample data for validation. Thus, we conducted a 5-fold cross-validation experiment. In 5-fold CV, the data are randomly partitioned into 5
equal-sized sub-samples. Of the 5 sub-samples, a single subsample is retained as the validation data for testing
the model, and the remaining 4 sub-samples are used as training data. The process is then repeated 5 times with each of the 5 sub-samples used exactly once as the validation data. The 5 results from the folds can then be averaged to produce a single estimation. We obtained 92% accuracy in terms of F1 Score in the detection of
devices’ states using the Random Forest classifier, as shown in Table 3.
Hold-out Validation: To make sure that our classifier can generalize well and is not over-fitted, we tested
the classifiers’ performance in terms of Precision, Recall, and F1 Score against unseen data (the data was
removed from the training set and is only used for this purpose). Table 5 shows the detailed results obtained
by the Random Forest classification algorithm when conducting the device state classification over 126 unseen
samples. As can be seen, the F1 Score of each device used in the experiment differs slightly. We obtained an
average performance measurement of 0.94 (94%) of correctly classifying activities. This shows that an attacker
can easily differentiate the devices’ states.
4.7 Stage-4: User Activity Inference
Modern smart home environments comprise several sensors and devices that are connected with each other and share information. These devices and sensors are configured as independent entities but work co-dependently to provide an autonomous system. Any user activity in a smart home can be inferred by observing the states of the devices and sensors [29].
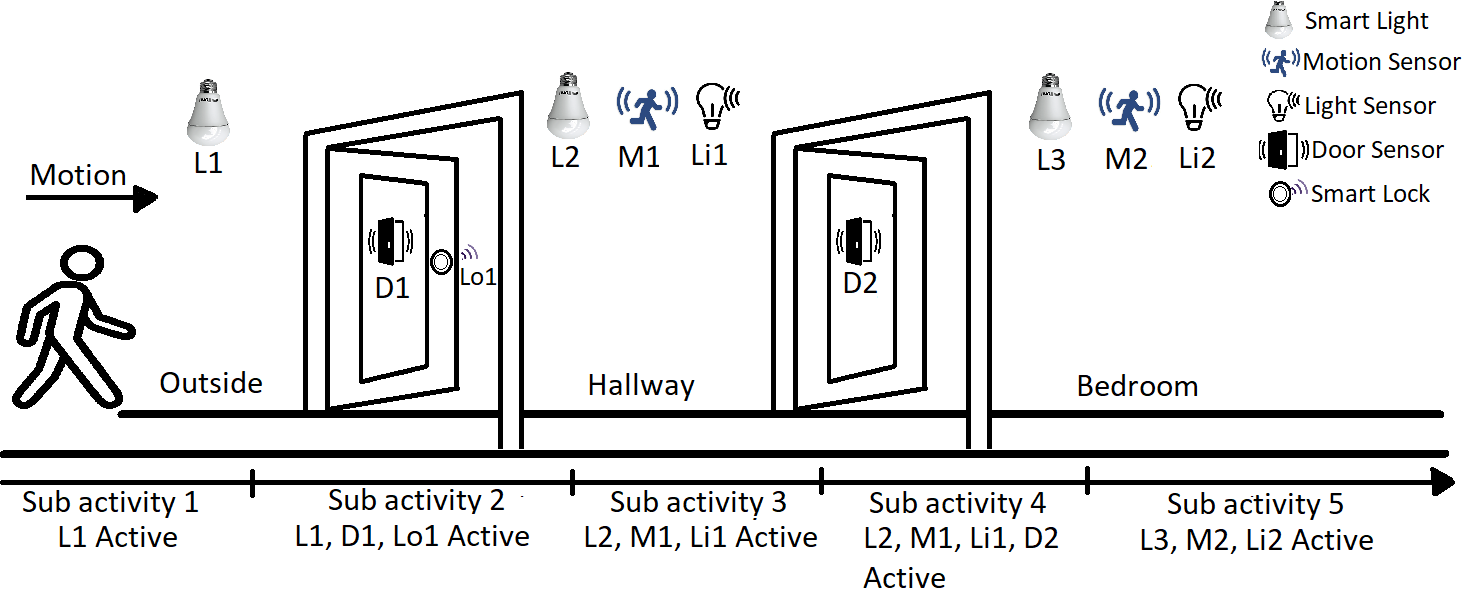
Figure 3. User walking scenario in a smart home environment
Modeling User Activities: Here, a user is entering the smart home from outside to the bedroom through the hallway. The scenario consists of five different devices with lights both inside and outside the home controlled by the motion sensor (M) and light sensor (L). This simple activity can be illustrated as a sequential pattern: Sub-activity 1- moving towards the door from the outside (L1 is active), Sub-activity 2- user opens the front door (L1, D1, Lo1 are active), Sub-activity 3- user enters the hallway (L2, M1, Li1 are active), Sub-activity 4- user enters the room (Li2, L2, M2, D1, Lo1 are active), Sub-activity 5- user inside the home (L2, M2, Li2 are active). To complete the activity, a user must follow the same sequence of sub-activities and complete each step. As discussed earlier, the devices’ states (active/inactive) for a specific time can be determined from the network traffic captured from the devices. These device states can be used to infer an on-going activity in a smart home setting.
Feature Extraction: To infer user activities, different device features must be extracted from network traffic data. Network traffic data contain several features including timing information, sensor information, device states, location, etc. Based on the data-type, the extracted features from the network traffic for user activity inference can be represented as follows:
Data array, ET = {S, D, M, L}, (2)
where T is the set of timing features extracted from the network traffic, S is the set of sensors’ features, D is
the set of device features, M is the features extracted from the controlling device (smartphone/tablet), and L
is the set of location features extracted from the network traffic. We describe the characteristics of these features
below.
– Timing features (T): Smart home devices change their state according to user activities and commands. Some devices perform time-independent tasks (e.g., switching lights with motion), while some devices perform a task in a certain pattern with different user activities (e.g., walking from one point to another) based on smart home settings. We extract the time of an event from the network traffic captured from different devices to build the overall state of the smart home at the time of the user activity.
– Sensor State features (S): A smart home environment consists of different sensors (e.g., motion sensor,
light sensor, door sensor, etc.) which act as a bridge between devices and the peripheral. Sensors in a
smart home can sense different environment parameters which can trigger different pre-defined tasks
in multiple devices. Moreover, sensors can sense any change occurred because of a user interaction and
forward this information as an input to the associated devices. These sensor data can be both logical
(motion sensor) and numerical (temperature sensor) depending on the nature of the sensor. We observe
the changes in both the logical and numerical value of a sensor from the captured network traffic and use as
a feature to infer user activities. We represent the changes in sensor data as binary output: 1 for active
state and 0 for inactive state.
– Device State features (D): In a smart home environment, multiple devices such as smart light, smart
thermostat, etc. can be connected with each other and with a central hub to perform different tasks.
These devices can be configured to change their states (active/inactive) to perform a pre-defined
task or to perform a task based on user activities. We consider the state information of all the connected devices as features and extract this information from captured network traffic to infer the ongoing user activity. The active and inactive states of the devices are illustrated as 1 and 0 respectively in the data array.
– Controller State features (M): Smart home devices can be controlled in an autonomous way and also by
using a controller device (smartphone/tablet). To understand the changes in states of the sensors and
devices, one should consider the control commands generated by the controller devices. We consider the
state of the controller device as active (represented as 1 in data array) when a user interacts with smart
home devices via controller device and inactive otherwise (represented as 0 in data array). This state information of the controller devices can be extracted from the captured network traffic to build the data array.
– Controller Location features (L): The devices connected in a smart environment can be controlled from a different location and this location information can be collected from the captured network traffic. We consider the location of the controller device as a feature to understand any activities on the smart home. We consider the home location of the controller device as 1 and the away location of the controller as 0 to represent the location feature as a binary number in the data array.
For Stage 4, we captured the network traffic from a smart home environment and create the feature array
explained in Equation 2. We captured the network traffic for a specific time to correctly portray user activities
from the network data. Each element of the data array represents the operating conditions of different smart devices, sensors, and controller devices. These data were then used to train a Hidden Markov Model (HMM) to
detect user activities in a smart home environment. In Appendix C, we show how we used HMM in order to
model user activities.
To train this HMM, we collected data from a smart home environment with real smart devices. We consider common smart home devices to build our training environment [15]. Our test smart home environment included Samsung SmartThings hub, Samsung multipurpose sensor, Samsung motion sensor, Netgear Arlo security camera, Philips Hue smart light, Ecobee Smart Thermostat, and August Smart Lock. We collected network traffic data from 10 different users for different user activities.
Activity Types: User activities in a smart home environment can be instantaneous (e.g., switching on a device) or sequential over time (e.g., walking from one place to another). We categorized user activities in a smart home environment in two categories – time-independent and time-dependent user activities.
– Time-independent Activities: These user activities are instantaneous, non-sequential activities which do not depend on time. For example, a user can switch on/off a device in the smart home environment at a specific time instance. This activity will show changes in different features for only one time.
– Time-dependent Activities: These user activities are time-dependent, sequential activities. For example,
a user can move from one point to another point. This activity will show changes in different features over time in a specific sequence.
We tested our HMM model with data collected from six different user activities. Our user activity model is
explained below.
– User Activity- 1. A user is controlling a device from inside of the smart home environment.
– User Activity- 2. A user is controlling a device from outside of the smart home environment.
– User Activity- 3. A user is performing tasks from a specific point of a smart home environment.
– User Activity- 4. A user is walking from one point to another inside the smart home environment.
– User Activity- 5. A user is entering/ exiting from the smart home environment.
– User Activity- 6. A user is opening/ closing a window/ door in smart home environment.
Results:
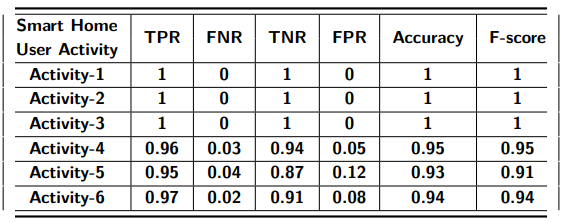
Table 7. User activity inference from network traffic data in a smart home environment.
To train our proposed HMM for user activity inference, we collected user activity data for a week from 15 different people (total 30 datasets) in an emulated smart home environment. We asked the users to perform their
daily activities in a timely manner (from morning to night) and performed the same activities in defined sequences in a real-life smart home setting. We considered single authorized smart home user interacting with
smart devices at a time for data collection. We trained our HMM model with these data. We also collected data
for this activity model to test our proposed method. We collected two datasets for each activity (12 in total) to
test the efficacy of the activity inference model.
In Table 7, the evaluation results of our activity inference model are shown. For time-independent activities (Activity-1, Activity-2, and Activity-3), one can infer with 100% accuracy and F-score from the captured network traffic data in a smart home environment. On the contrary, accuracy and F-score decreases slightly for time-dependent activities as these activities introduce FP and FN instances in the activity inference model. For Activity-4, our proposed stage 4 activity inference HMM can achieve both accuracy and F-score over 95%. The false positive rate (FPR) and false negative rate (FNR) are over 5% and 3% respectively for Activity-4. For Activity-4 and Activity-5, the accuracy of user activity inference decreases (93% and 94% respectively) while FPR and FNR increases. The reason for the increment of FPR and FNR is that different time-dependent user activities can have similar patterns over time with small changes in specific time instances. This affects the probability of occurring an activity calculated from HMM. In summary, an attacker can infer time-independent activities more accurately (with 100% accuracy and F-score) than the time-dependent activities (with over 95% accuracy and F-score).
Finally, note that an accurate user activity inference means that all the stages in the multi-stage attack have to be correctly guessed, which may lower the end-to-end successful inference rate of the attacker. For example, if the stage 1, 2, 3, and 4 are X, Y , Z, and T, respectively, for an attacker, the probability of correctly guessing the Activity-4 of the user is X ×Y ×Z ×T. However, we also note that independently inferred information in every stage is also valuable as it may also include sensitive information (e.g., inferring the device type of a connected medical device may reveal the health status of the subject [33]).
5 Mitigating the Privacy Leaks
Despite the security vulnerabilities exploited before, as these privacy concerns are inherent and insidious, it is
too hard to detect and avoid these types of threats associated with smart home devices. An attacker can passively listen to the wireless medium and record all the network traffic from a smart home environment without
interrupting the normal activities of devices and their users.
5.1 Straightforward Solutions
Using VPN or Tor-like Tools: The use of a VPN will prevent an attacker from recording the victim’s traffic after the gateway as it is going to be encrypted by the VPN provider. Even an ISP cannot record the network traffic of the user. On the other hand, Tor will make the source and destination IPs impossible to determine for the ISP. Both methods will prevent the attacker to follow the communication between the home AP and the server of the hub. However, it provides no protection against an attacker within range (e.g., outside, near home) and sniffing the internal traffic.
Signal Attenuation: A signal attenuator can be used in theory to protect from an attacker sniffing the internal network traffic of the smart home. This can be realized via a wired connection or using Faraday cages [30]. Nonetheless, forcing all the devices to such a modification in the hardware level and a Faraday cage could be too unrealistic and very expensive to set up for the smart home users.
Traffic Shaping: The traffic shaping solutions have been widely studied in the literature on website classifiers. Padding to proper MTU, exponential padding, or random padding are some of the countermeasures with the traffic shaping methods. Indeed, not only padding but also constant or random delays can be applied to the packets transmitted to protect from inference attacks. In all these solutions, the underlying protocol, which needs to provide real-time accurate values from the devices is modified in a way that unfortunately lowers the efficiency and accuracy of the devices.
5.2 Proposed Approach
In this sub-section, we propose a solution based on generating spoofed traffic. In this way, even if the user is not
at home, generating false activity for the user’s presence traffic will mask the user’s absence.
In order to measure the efficacy of our proposed spoofed traffic, we investigated the injection of false
packets by modifying the feature vectors and evaluated how the performance measurements would change.
Then, we applied it to the device state detection and device activity classification attacks. Since the user activity inference is based on the results of the device state detection and device activity classification attacks, if we
can falsify their results, the attacker will not able to infer the activities correctly. Particularly, we conducted a
set of experiments where we injected falsified data into the training set to observe how the previously shown
detection and classification algorithms would behave in such a situation. The results are shown in Figure 4.
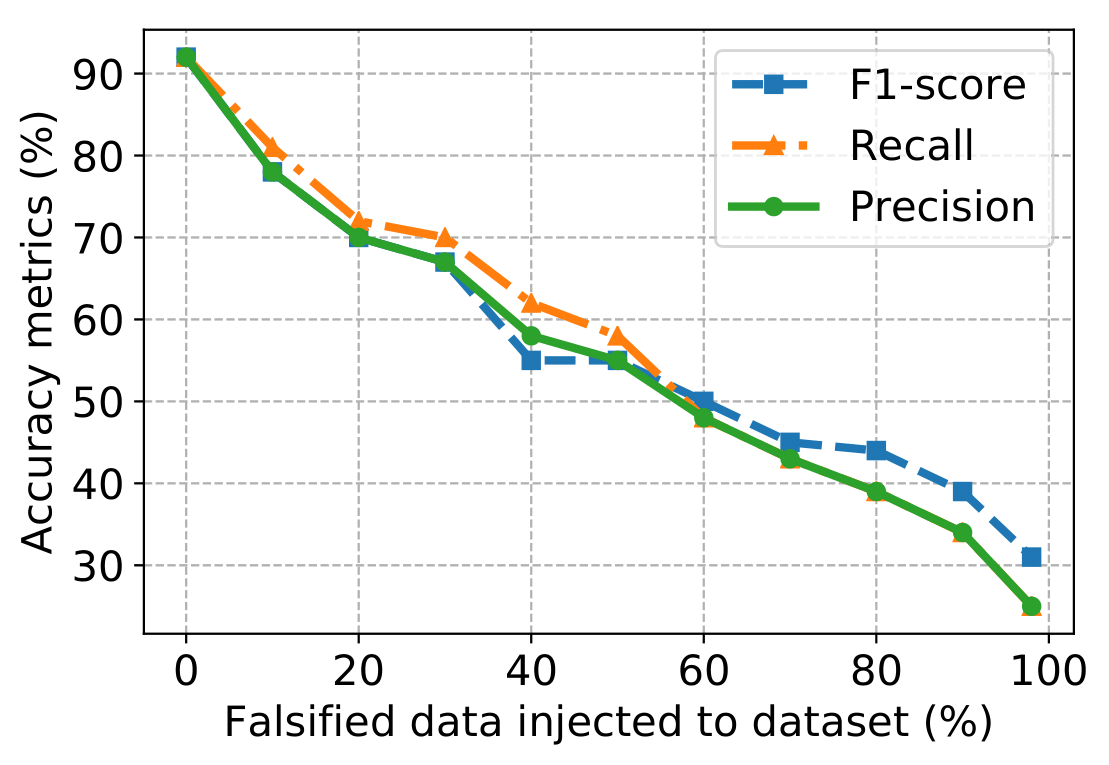
Fig. 4a. Impact of false data injection experiments on the device state detection attack accuracy.
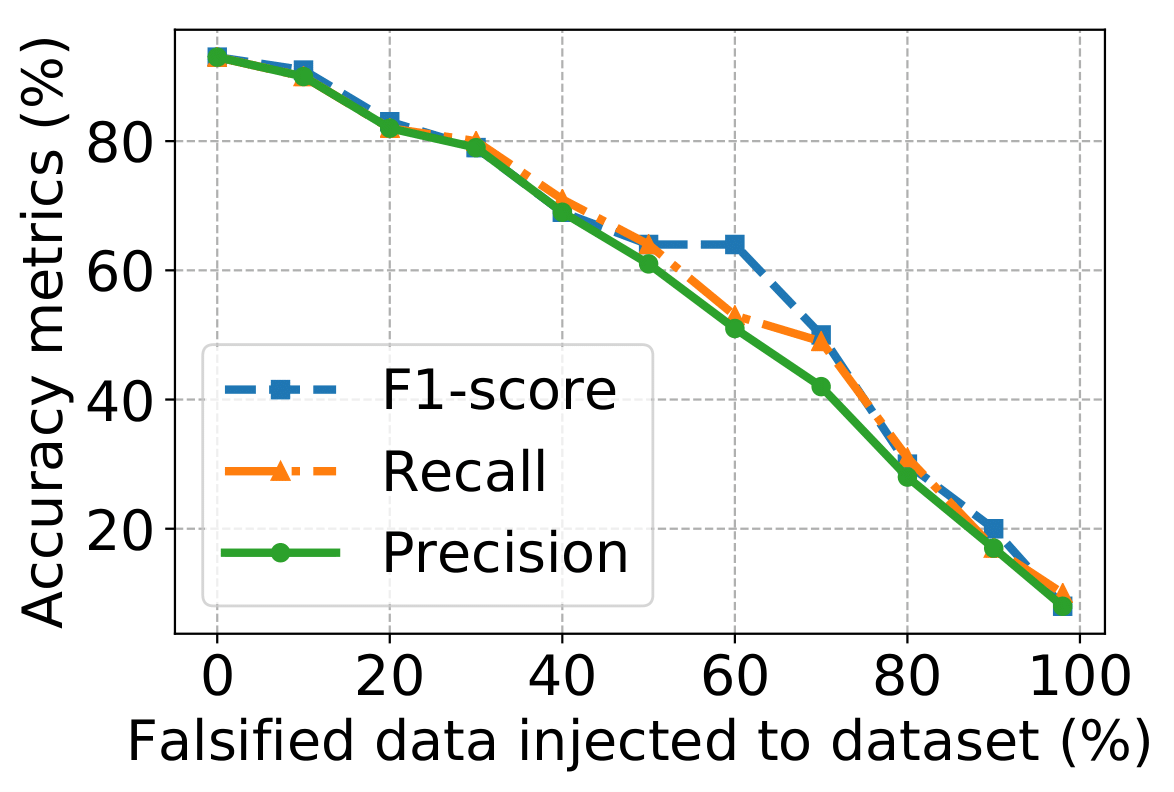
Fig. 4b. Impact of false data injection experiments on the device state classification attack
Impact of False Data Injection on Device State Detection. Figure 4a shows the average of the accuracy measures for the KNN algorithm after increasingly injecting false packets. When there is no injected false
packet, all of the devices have 91% F1 score, then it linearly decreases with the increase of false packets. For
example, injecting false data equivalent to 10% of packets exchanged during the observation time resulted in a
decrease by 13%. For 90% false traffic addition, the accuracy of device state detection declined by about 57%.
This shows that traffic injection can be efficiently used for hiding the state of devices from the adversary.
Impact of False Data Injection on Device State Classification. We injected the falsified data into the
training data and computed the accuracy metrics in terms of F1 Score, Precision, and Recall. We injected
10% falsified data and continued injecting until 90% of the dataset contained false data. As can be seen in Figure 4b, the F1 Score plunges dramatically when injecting 90% false data and reaches 15%. This is due to the
fact that randomly falsified features deteriorate traffic patterns used for classifying the devices’ states. Also
here, we can see that by injecting increasing amounts of fabricated traffic, the adversary can effectively be prevented from making inferences about the types of device events occurring.
6 Discussion
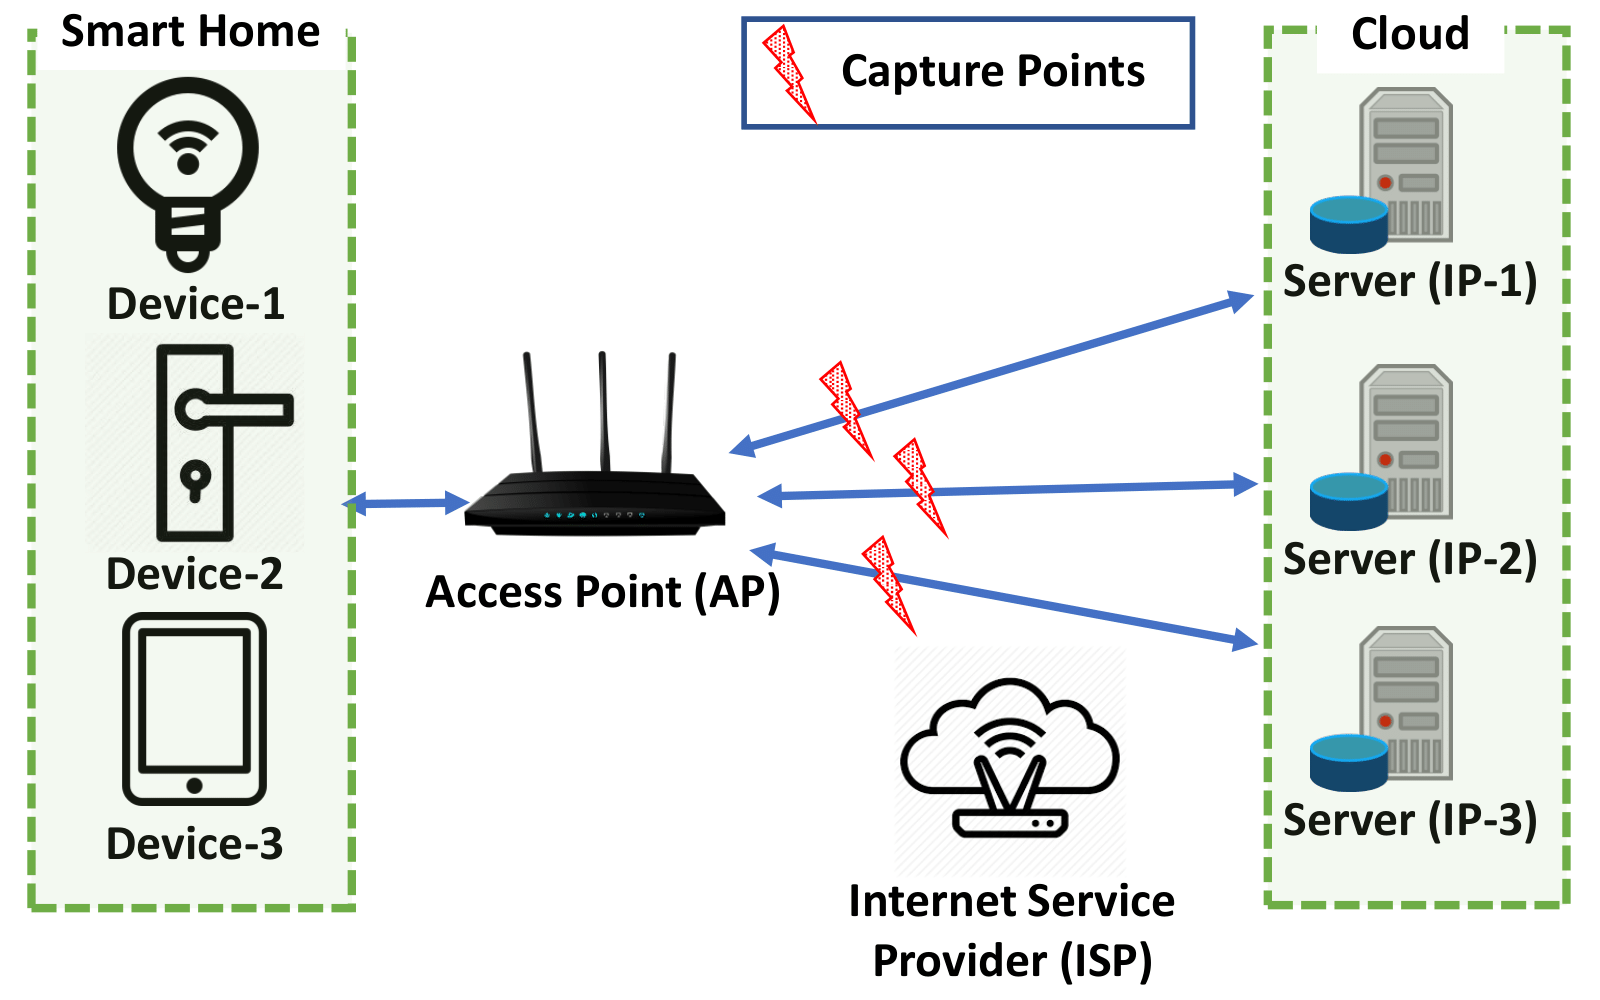
Figure 5. Remote adversary model (e.g., a malicious ISP).
ISP as an adversary: Note that so far, our adversary model included only local adversaries, where the adversary is within the range of radiofrequency. An extension to this adversary model can be a remote adversary
that can monitor outgoing network traffic of the smart home. A concrete example of such an adversary is an
ISP. Compared to the local adversary model considered in this paper, an ISP-like adversary has both advantages and disadvantages. It does not have to be within a range and it can see the source and destination IPs of the packets, which a local adversary can not see if the WPA encryption is enabled. However, it can only collect the outgoing network traffic, not the internal two-way (upstream and downstream) network traffic as all the
traffic is merged by the gateway (i.e., access point). Figure 5 shows the complete topology of the network from
the device to the cloud.
As can be seen in Figure 5, an ISP will only see the router’s (i.e., gateway/access point) MAC address. Therefore, it can not use the MAC addresses of the smart home devices for device identification. However, it can still try to use IPs in order to identify the devices and infer activities. Though there are a number
of challenges that an attacker needs to solve in order to able to use IP as a device identifier. First of all, if Network Address Translation (NAT) is deployed by the AP1, the ISP can not find out the topology of the smart home and the number of devices. Even though NAT is not enabled, ZigBee and BLE devices have never been assigned an IP as they communicate with the AP through a hub, where only the hub they are connected to gets
an IP. Moreover, devices do not communicate with only one server. Instead, sometimes multiple devices use one server (i.e., destination IP) as in the Samsung ST Hub, or sometimes one device can use multiple servers [5, 12]. Therefore, even though the ISP-like attacker has some advantages (i.e., seeing IPs) over the local adversary, there are several additional challenges that it needs to solve to get the same attack working. We leave this kind of adversary out of scope for now and will be studied in future work.
Multi-user vs. single user: Smart home devices support multiple authorized users. In a multi-user smart
home scenario, more than one user can control and change the settings of smart devices. Additionally, different users can perform different activities within the smart environment at a time. This can create some false
positive and false negative cases in user activity inference using our proposed method. Nonetheless, an attacker can still infer the device type and devices states from the network traffic. Additionally, the attacker can
also infer the presence of multiple users and the specific point of ongoing activities in multi-user smart home
environment using the network traffic. Compared to a multi-user scenario, a single user smart home environment is more vulnerable to our proposed threat as it is easier to infer a single on-going user activity in the
smart home.
Local vs. remote control: To improve the user control over smart devices and increase convenience, smart
homes offer remote access control in addition to traditional local access. Our proposed threat model can guess
both local and remote access from location feature of the captured network traffic. This is a serious threat to user
privacy as attackers can detect when a user is changing the state of a specific device remotely and perform
malicious activities. For example, an attacker can infer when a user is accessing the smart lock remotely, which
may result in physical access to the home environment. Smart device diversity: Smart devices have no common network protocols. Indeed, some of them such as WiFi, ZigBee, and BLE are more popular than others. This makes it harder to sniff all the devices that the smart home user is using. In addition to the diversity of network protocols, smart home devices come with different computational resources, hardware types, capabilities, exchanged data format etc. All of these differences in smart devices make it very challenging to build a
generic solution as well as an attack. However, with our automated multi-stage privacy-attack, we showed the
feasibility of the attack with the most popular network protocols, which covers the most of the commercial devices.
Limitations of defense: As our results show, injecting false data to the communication clearly decreases
the accuracy of the attacks. However, even though it is an effective method and it has the advantage of not affecting the efficiency of real traffic on the devices, but it requires an extension to the protocols to put a flag
on the fake activities, which will be known by both devices and server. Here, we propose two different ways
to implement this solution with trade-offs on the power consumption and security.
- Only on the Hub: This countermeasure can be implemented only on the smart hub devices and does not
require relatively-constrained smart home devices to be part of the countermeasure. Even though this
type of solution is effective and better for battery-powered devices, it can be discovered by the attacker; after a while, an attacker can use the network traffic from the device(s) to hub only, but the attacker’s success and accuracy will decrease in that case. - On the Hub and Device: This countermeasure requires to modify the communication protocol both
on the smart home device and the hub. This will generate a more realistic interaction between the device and the hub, but this may cause slightly more power consumption (depending on the size of the
extra field for the flag) in the device and requires a modification on the devices to send the false data.
Depending on the devices, where the solution to be implemented on, the required modification in the current system and the implementer can change. For example, if our solution is preferred to be implemented only on the hub, then it can be implemented by the manufacturer of the hub only. However, if it is going to be implemented on the devices and the hub together, it requires either the collaboration of both sides or a protocol-level modification.
Generalizability of the attack: As we noted in the assumptions, the attacker we considered in this paper
does not need exactly the same devices to train its attack model, but it needs exact brand and device type
to get the results presented in this paper as we use the < brand, device − type > pair to uniquely identify devices. In other words, we assume at the end of the device identification stage of our attack, the attacker knows
< brand, device − type > pair. However, this assumption weakens the attack model. An attacker who can
infer the device type and does not need the same device with the same brand would be more realistic. In
order to remove this assumption, the same device type with different brands should be used to train the models
and to attack (i.e., testing). It would be interesting to train and test the attack models on the same device type
with different brands, or the same brand with different device types. Moreover, it would be also interesting to
test the affects of model numbers, device configurations, or firmware updates etc.
7 Related Work
Identification using the encrypted network traffic. The meta-data (e.g. MAC, traffic rate) of encrypted
network traffic triggers possible threats including unintentional disclosure of the content or user. There is an
extensive literature in the identification of the content from the encrypted network traffic. For example, web
page identification [32], web user identification [22], protocol identification [36] are some of the research on the
identification using the encrypted traffic. Not only identification attacks, but also the countermeasures have
been studied in several studies [9, 16].
Smartphone Fingerprinting. Recently, this research has been extended to smartphone users. For example, Conti et al. [11] showed a way of identifying user action on Android apps and Taylor et al. [34] presented their work the fingerprinting of apps from an encrypted network of the smartphone. In addition, [31] fingerprints the smartphones using the network traffic captured generated from the popular applications such as Facebook, WhatsApp. Finally, in [6], Ateniese et al. showed a new adversary model that can infer the location of the user from the encrypted network traffic. Fingerprinting Methods. In all the aforementioned studies, either statistical techniques [35] or machine learning methods [11] were used to infer different sensitive information about the user and the context. Even ML has been used for the task of identification such as user, device, or website identification, in none of these studies, the attacks are timing-based as we have in our work.
IoT Fingerprinting. So far, in all the aforementioned studies the results showed that the used methods are
efficient and the threat is real, but the threat was limited to the web and online privacy of the user. Now with
the emergence of IoT, it has been extended every part of our daily lives and, with this, threats and countermeasures have also evolved [2, 28]. When we look at the IoT context, there have been only a few works on the fingerprinting research. Miettinen et al. [24] presented a device type identification method using the packet
header-based features (e.g., protocol, port number) and Bihl et al. [8] proposes an optimization framework that
can be applied to Z-Wave device fingerprinting. These works are on device fingerprinting. On the other hand,
the most closest works to ours are presented in the user action identification from the network traffic of IoT devices. In [12], Copos et al. shows their work on inferring the user activity from Nest Thermostat and Nest CO
Detector, where they are only doing with a simple correlation analysis. The most similar studies to ours are
[4, 5, 30], where in [5], the similar privacy analysis has been done only on 7 devices with WiFi and in [30], the
analysis has been done with motion and contact sensors only. In both [5, 30], the inference attack covers only
device activity classification.
Difference from existing work. However, in our work, we included a more comprehensive analysis of the
ecosystem. Specifically, we are working on 22 devices supporting a wide range of protocols (i.e, WiFi, ZigBee,
and BLE) where earlier works only evaluate their attack models on the WiFi traffic. We are extending the evaluation of privacy attacks more in-depth by using ML methods to automatize the detection and classification
of device states and we use HMM in order to model and guess the on-going user actions and activities, which is
another novel contribution of this work. We also discuss the limitations of their proposed countermeasures and
propose another approach to defend against the novel multi-stage privacy attack proposed in this paper.
8 Conclusion
In this paper, we explored how encrypted traffic from a smart home environment can be used to infer sensitive
information about smart devices and sensors. Specifically, we introduced a novel multi-stage privacy attack,
which an attacker can exploit to automatically detect and identify particular types of devices, their actions,
states, and related user activities by passively monitoring the traffic of smart home devices and sensors. Our
evaluation on an extensive list of off-the-shelf smart home devices, sensors, and real users showed that an
attacker can achieve very high accuracy (above %90) in all the attack types. As opposed to earlier straightforward activity identification approaches, the novel multi-stage privacy attack can perform detection and
identification automatically, is device-type and protocolagnostic, and does not require extensive background knowledge or specifications of analyzed protocols. Finally, we propose a new yet effective mitigation mechanism to hide the real activities of the users. The effectiveness of the multi-stage privacy attack raises serious privacy concerns for any smart environment equipped with smart devices and sensors including personal homes, residences, hotel rooms, offices of corporations or government agencies.
References
[1] tsfresh. https://github.com/blue-yonder/tsfresh, 2018.
[2] Abbas Acar, Hidayet Aksu, A Selcuk Uluagac, and Kemal Akkaya. Waca: Wearable-assisted continuous authentication. In Security and Privacy Workshops (SPW), 2018 IEEE, 2018.
[3] IoT Analytics. State of the smart home market 2017, 2017.
[4] Noah Apthorpe, Dillon Reisman, and Nick Feamster. A smart home is no castle: Privacy vulnerabilities of encrypted iot traffic. arXiv preprint arXiv:1705.06805, 2017.
[5] Noah Apthorpe, Dillon Reisman, Srikanth Sundaresan, Arvind Narayanan, and Nick Feamster. Spying on the smart home: Privacy attacks and defenses on encrypted iot traffic. arXiv preprint arXiv:1708.05044, 2017.
[6] Giuseppe Ateniese, Briland Hitaj, Luigi Vincenzo Mancini, Nino Vincenzo Verde, and Antonio Villani. No place to hide that bytes won’t reveal: Sniffing location-based encrypted traffic to track a user’s position. In International Conference on Network and System Security, pages 46–59. Springer, 2015.
[7] Bruhadeshwar Bezawada, Maalvika Bachani, Jordan Peterson, Hossein Shirazi, Indrakshi Ray, and Indrajit Ray. Iotsense: Behavioral fingerprinting of iot devices. arXiv preprint arXiv:1804.03852, 2018.
[8] Trevor Bihl, Michael Temple, and Kenneth Bauer. An optimization framework for generalized relevance learning vector quantization with application to z-wave device fingerprinting. In Proceedings of the 50th Hawaii International Conference on System Sciences, 2017.
[9] Xiang Cai, Xin Cheng Zhang, Brijesh Joshi, and Rob Johnson. Touching from a distance: Website fingerprinting attacks and defenses. In Proceedings of the 2012 ACM conference on Computer and communications security, pages 605–616. ACM, 2012.
[10] Z. Berkay Celik, Leonardo Babun, Amit K. Sikder, Hidayet Aksu, Gang Tan, Patrick McDaniel, and A. Selcuk Uluagac. Sensitive information tracking in commodity iot. In USENIX Security Symposium, Baltimore, MD, August 2018.
[11] M. Conti, L. V. Mancini, R. Spolaor, and N. V. Verde. Analyzing android encrypted network traffic to identify user actions. IEEE Transactions on Information Forensics and Security, 11(1):114–125, Jan 2016.
[12] Bogdan Copos, Karl Levitt, Matt Bishop, and Jeff Rowe. Is anybody home? inferring activity from smart home network traffic. In Security and Privacy Workshops (SPW), 2016 IEEE, pages 245–251. IEEE, 2016.
[13] Asish Kumar Dalai and Sanjay Kumar Jena. Wdtf: A technique for wireless device type fingerprinting. Wireless Personal Communications, 97(2):1911–1928, 2017.
[14] Aveek K Das, Parth H Pathak, Chen-Nee Chuah, and Prasant Mohapatra. Uncovering privacy leakage in ble network traffic of wearable fitness trackers. In Proceedings of the 17th International Workshop on Mobile Computing Systems and Applications, pages 99–104. ACM, 2016.
[15] Christian de Looper. The 12 best smart home devices you need to live like the jetsons, 2017.
[16] Kevin P Dyer, Scott E Coull, Thomas Ristenpart, and Thomas Shrimpton. Peek-a-boo, i still see you: Why efficient traffic analysis countermeasures fail. In Security and Privacy (SP), 2012 IEEE Symposium on, pages 332–346. IEEE, 2012.
[17] Kassem Fawaz and et al. Protecting Privacy of BLE Device Users. In USENIX Security Symposium, 2016.
[18] David Formby and et al. Who’s in Control of Your Control System? Device Fingerprinting for Cyber-Physical Systems. In NDSS, 2016.
[19] Jun Han, Albert Jin Chung, Manal Kumar Sinha, Madhumitha Harishankar, Shijia Pan, Hae Young Noh, Pei
Zhang, and Patrick Tague. Do you feel what i hear? enabling autonomous iot device pairing using different sensor types. In Do You Feel What I Hear? Enabling Autonomous IoT Device Pairing using Different Sensor Types, page 0. IEEE, 2018.
[20] Mordor Intelligence. Iot sensor market size – segmented by type (pressure sensor, temperature sensor, proximity sensor), end-user industry (healthcare, automotive, consumer electronics), and region – growth, trends, and forecast (2018 – 2023), 2018.
[21] Huaxin Li, Zheyu Xu, Haojin Zhu, Di Ma, Shuai Li, and Kai Xing. Demographics inference through wi-fi network traffic analysis. In Computer Communications, IEEE INFOCOM 2016-The 35th Annual IEEE International Conference on, pages 1–9. IEEE, 2016.
[22] Marc Liberatore and Brian Neil Levine. Inferring the source of encrypted http connections. In Proceedings of the 13th ACM conference on Computer and communications security, pages 255–263. ACM, 2006.
[23] Yair Meidan, Michael Bohadana, Asaf Shabtai, Martin Ochoa, Nils Ole Tippenhauer, Juan Davis Guarnizo, and Yuval Elovici. Detection of unauthorized iot devices using machine learning techniques. arXiv preprint arXiv:1709.04647, 2017.
[24] Markus Miettinen, Samuel Marchal, Ibbad Hafeez, N Asokan, Ahmad-Reza Sadeghi, and Sasu Tarkoma. Iot
sentinel: Automated device-type identification for security enforcement in iot. In Distributed Computing Systems (ICDCS),
2017 IEEE 37th International Conference on, pages 2177– 2184. IEEE, 2017.
[25] Nam Thanh Nguyen, Dinh Q Phung, Svetha Venkatesh, and Hung Bui. Learning and detecting activities from movement trajectories using the hierarchical hidden markov model. In Computer Vision and Pattern Recognition, 2005. CVPR 2005. IEEE Computer Society Conference on, volume 2, pages 955–960. IEEE, 2005.
[26] Thien Duc Nguyen, Samuel Marchal, Markus Miettinen, Minh Hoang Dang, N Asokan, and Ahmad-Reza Sadeghi. D\” iot: A crowdsourced self-learning approach for detecting compromised iot devices. arXiv preprint arXiv:1804.07474, 2018.
[27] Amit Kumar Sikder, Abbas Acar, Hidayet Aksu, A Selcuk Uluagac, Kemal Akkaya, and Mauro Conti. Iot-enabled smart lighting systems for smart cities. In Computing and Communication Workshop and Conference (CCWC), 2018 IEEE 8th Annual, pages 639–645. IEEE, 2018.
[28] Amit Kumar Sikder, Hidayet Aksu, and A Selcuk Uluagac. 6thsense: A context-aware sensor-based attack detector for smart devices. In USENIX Security, 2017.
[29] Amit Kumar Sikder, Giuseppe Petracca, Hidayet Aksu, Trent Jaeger, and A Selcuk Uluagac. A survey on sensor-based threats to internet-of-things (iot) devices and applications. arXiv preprint arXiv:1802.02041, 2018.
[30] Vijay Srinivasan, John Stankovic, and Kamin Whitehouse. Protecting your daily in-home activity information from a wireless snooping attack. In Proceedings of the 10th international conference on Ubiquitous computing, pages 202–211. ACM, 2008.
[31] Tim Stöber, Mario Frank, Jens Schmitt, and Ivan Martinovic. Who do you sync you are?: smartphone fingerprinting via application behaviour. In Proceedings of the sixth ACM conference on Security and privacy in wireless and mobile networks, pages 7–12. ACM, 2013.
[32] Qixiang Sun, Daniel R Simon, Yi-Min Wang, Wilf Russell, Venkata N Padmanabhan, and Lili Qiu. Statistical identification of encrypted web browsing traffic. In Security and Privacy, 2002. Proceedings. 2002 IEEE Symposium on, pages 19–30. IEEE, 2002.
[33] Thomas Søderholm. Eu gdpr: Privacy for connected medical devices, 2017.
[34] Vincent F Taylor, Riccardo Spolaor, Mauro Conti, and Ivan Martinovic. Appscanner: Automatic fingerprinting of smartphone apps from encrypted network traffic. In Security and Privacy (EuroS&P), 2016 IEEE European Symposium on, pages 439–454. IEEE, 2016.
[35] Petr Velan, Milan Čermák, Pavel Čeleda, and Martin Drašar. A survey of methods for encrypted traffic classification and analysis. International Journal of Network Management, 25(5):355–374, 2015.
[36] Charles V Wright, Fabian Monrose, and Gerald M Masson. On inferring application protocol behaviors in encrypted network traffic. Journal of Machine Learning Research, 7(Dec):2745–2769, 2006.
- “Security flaws found in popular smart home devices”, PBS NEWS HOUR, Jamie Leventhal, November 6, 2019
-
- “Encryption doesn’t stop him or her or you… from working out what Thing 1 is up to”, The Register, Richard Chirgwin, August 10, 2018
-
- “Research result that the ‘smart home’ constructed by IoT may be peeping at life even if encrypting communication”, Gigazine, Richard Chirgwin, August 15, 2018
-
- https://gigazine.net/news/20180815-traffic-show-your-life/ (In Japanese)